OpenTelemetry: How to Monitor Modern Applications Efficiently
In today’s fast-paced cloud-native ecosystem, observability has become a cornerstone of resilient, maintainable systems. With services scattered across containers, Kubernetes clusters, and various tech stacks, understanding system behaviour is no longer a luxury — it’s a necessity. OpenTelemetry offers a robust, standardised solution to capture traces, metrics, and logs in a way that scales. Let’s explore how this framework can be applied practically, especially when working with JavaScript and Python backends and visualisation tools like Grafana and Prometheus.
Why Observability Matters in Distributed Systems
Modern software applications, especially those built as microservices or serverless architectures, involve multiple moving parts communicating over a network. In such environments, debugging an issue or detecting performance bottlenecks without proper observability is extremely difficult. Logs may be spread across several containers, metrics might be buried under dashboards, and tracing user requests becomes complex without a unified toolset.
OpenTelemetry, backed by the Cloud Native Computing Foundation (CNCF), addresses these challenges. It provides a single, vendor-neutral instrumentation library that can be used across languages and platforms. With support for automatic instrumentation and context propagation, it ensures your telemetry data reflects the complete journey of a request through your stack.
By enabling developers and DevOps teams to collect, process, and export telemetry data from their applications, OpenTelemetry makes it easier to identify failures, slowdowns, and unusual behaviour in real time. The end result is improved reliability, faster incident response, and better overall user experience.
Integrating OpenTelemetry with JavaScript and Python
OpenTelemetry provides SDKs for both JavaScript and Python, making it simple to add instrumentation to applications. For Node.js, you can use `@opentelemetry/sdk-node` alongside packages like `@opentelemetry/instrumentation-http` to trace HTTP calls automatically. Python offers similar functionality via `opentelemetry-sdk` and instrumentations like `opentelemetry-instrumentation-flask` or `django`.
In a Node.js application, you typically set up a tracing provider, register instrumentations, and export traces to a backend like the OpenTelemetry Collector or directly to Jaeger or Zipkin. Similarly, in Python, you define a `TracerProvider`, configure a `BatchSpanProcessor`, and export spans using OTLP (OpenTelemetry Protocol) exporters.
Both SDKs support environment variables, making it easier to deploy instrumented applications in different environments. This flexibility is especially useful in Kubernetes setups where configurations are often managed via Helm charts or operators.
Visualising Telemetry Data with Prometheus and Grafana
Prometheus and Grafana are among the most widely adopted tools for monitoring and visualisation in the cloud-native space. OpenTelemetry integrates well with both, enabling you to stream application metrics into Prometheus and visualise them with Grafana’s dynamic dashboards.
The OpenTelemetry Collector serves as a central hub to receive, process, and export telemetry data. It can be configured with receivers (e.g., OTLP, Jaeger), processors (e.g., batching, filtering), and exporters (e.g., Prometheus, Loki). For metrics, the Collector can scrape instrumented applications or receive push-based data and expose it via an endpoint that Prometheus can scrape.
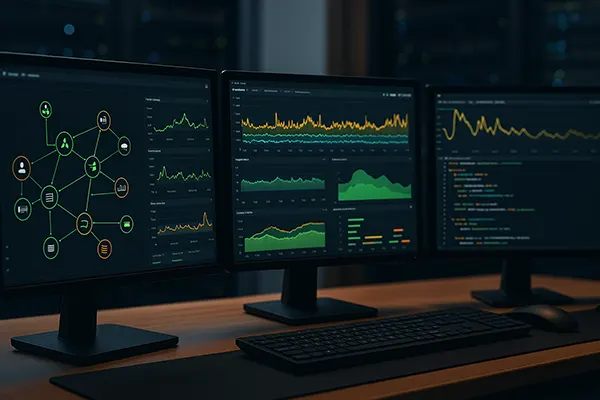
Grafana, in turn, can be configured to read from Prometheus and display rich dashboards, alerts, and trends. This visual layer is crucial for identifying spikes in latency, dropped requests, or anomalies in usage patterns across your services.
Best Practices for Metrics and Dashboards
When exposing metrics to Prometheus, use consistent naming conventions and label keys. Avoid high-cardinality labels (e.g., user IDs), as they can lead to performance degradation. Instead, focus on service-level metrics like latency, request counts, and error rates.
Define Service Level Indicators (SLIs) and Objectives (SLOs) for each critical service. Track these on Grafana dashboards and use alerting to notify when thresholds are breached. This proactive approach ensures operational issues are detected before users notice them.
Also, consider dashboard hygiene: avoid clutter, group metrics logically, and provide descriptions. Grafana’s templating and variable features can help you create reusable dashboards across environments or services.
OpenTelemetry Implementation Strategies for DevOps Teams
Rolling out OpenTelemetry across an organisation requires a clear strategy. Start with critical services where observability gaps are most costly. Use automatic instrumentation where possible to gain quick wins, then proceed to manual instrumentation for business-specific flows.
Establish a central observability platform based on the OpenTelemetry Collector. This allows your team to standardise configurations and manage data pipelines across environments. Ensure role-based access controls and data retention policies are in place, especially when dealing with sensitive information.
Training is essential — ensure developers and ops engineers understand how to use OpenTelemetry SDKs, interpret trace data, and create actionable dashboards. Consider incorporating observability into CI/CD pipelines to catch regressions early through synthetic tests and telemetry validation.
Balancing Cost and Value in Telemetry Collection
Telemetry can quickly become expensive if not managed carefully. Exporting every span or capturing too many metrics can overwhelm storage systems and inflate infrastructure costs. Use sampling strategies like probabilistic sampling or tail-based sampling to reduce noise while retaining valuable insights.
For logs, consider structured logging and centralisation tools like Fluent Bit or OpenTelemetry logs pipeline. Use dynamic log levels to reduce verbosity in production while preserving details in lower environments.
Ultimately, telemetry should serve the business. Focus on collecting data that helps your team make decisions, improve reliability, and satisfy service-level goals. Anything beyond that can be trimmed or optimised for cost-efficiency.