OpenTelemetry and ClickHouse: Real-Time Performance Analytics
Modern systems demand instant insights, especially when it comes to performance monitoring. OpenTelemetry and ClickHouse provide a powerful duo for building real-time analytics pipelines. This article explores their integration through a Prometheus-based architecture, highlighting dashboard implementation and load testing strategies. All information is valid as of June 2025.
Telemetry Architecture: From Prometheus to ClickHouse
The telemetry stack in modern observability setups often begins with Prometheus. As a popular time-series database, Prometheus efficiently scrapes metrics from applications and services. However, for more advanced analytics and longer data retention, ClickHouse becomes essential. It offers high-speed ingestion and querying capabilities, making it suitable for real-time performance insights.
To bridge Prometheus and ClickHouse, the OpenTelemetry Collector is used. It acts as a pipeline processor, receiving, transforming and exporting telemetry data. Prometheus metrics are first scraped and then passed through the Collector, which converts them into the OpenTelemetry protocol and pushes them to ClickHouse.
This architecture ensures scalability, modularity, and improved control over telemetry flow. It supports both push and pull models, allowing engineers to define resource-efficient and fault-tolerant observability pipelines using a YAML configuration that aligns with specific project needs.
Collector Configuration and Optimisation
Setting up the OpenTelemetry Collector involves defining receivers, processors, and exporters. In this use case, the Prometheus receiver is responsible for scraping, while processors aggregate and enrich metrics. The ClickHouse exporter, such as `otel-clickhouse`, ensures data is transformed into the columnar format required by the database.
Proper batching and compression significantly improve throughput. Recommended practices include setting batch sizes according to network latency and ensuring retries for transient failures. By placing the Collector on a dedicated node or container, noise and latency can be minimised during data ingestion.
Security is also vital. TLS encryption and access control for all communication channels between Prometheus, Collector, and ClickHouse should be enforced to ensure data integrity and confidentiality in production environments.
Real-Time Dashboard Visualisation
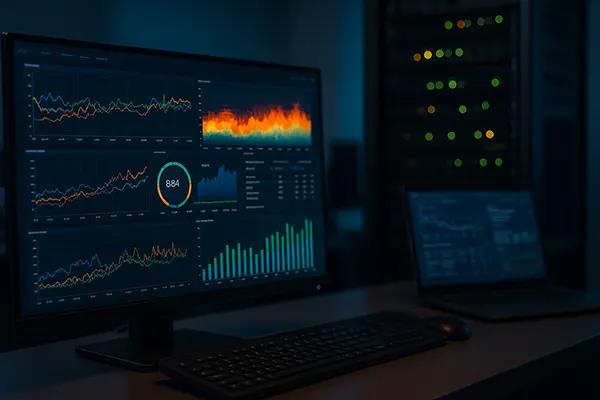
Once the pipeline is configured, the next step is visualisation. Real-time dashboards help DevOps teams understand how systems behave under specific conditions, offering a fast feedback loop for incident response and optimisation. Tools like Grafana support native integration with ClickHouse as a data source.
In Grafana, dashboards are configured to query ClickHouse using SQL-like syntax. Time series are displayed in graphs, heatmaps, and tables, reflecting CPU usage, memory consumption, and I/O performance metrics. Dashboards can be templated to support multi-cluster or multi-service views, improving reusability and consistency.
To enable real-time updates, queries are written with time-window functions such as `now() – INTERVAL` and utilise ClickHouse materialised views for pre-aggregation. This approach reduces query cost and ensures sub-second refresh rates, even with high data volumes streaming into the database.
Monitoring Dashboards in Production
Effective dashboards prioritise actionable insights. Avoid cluttering the screen with too many panels or metrics that lack context. Focus on key indicators like latency percentiles (p50, p95, p99), error rates, and request throughput. Group related panels to reflect the architecture of your services.
Annotation and alert integration is equally crucial. ClickHouse supports user-defined metrics and alert thresholds, which can be connected to Grafana’s alerting engine. Alert rules should be based on trends rather than spikes to avoid noise and improve signal-to-noise ratio.
Access control for dashboards ensures that only authorised personnel can modify or access sensitive metrics. In regulated environments, auditing dashboard usage and access logs helps maintain compliance and accountability.

Performance Testing and Stress Benchmarking
To validate your observability stack under realistic conditions, performance testing is required. Simulating production-like traffic helps expose bottlenecks in data collection, transmission, and storage. Tools such as k6 or Locust can generate synthetic loads with predictable patterns.
During load testing, telemetry from OpenTelemetry provides real-time visibility into Collector queue sizes, dropped metrics, and processing latency. Metrics like `processor_queue_length` and `exporter_send_failed` can be directly queried in dashboards, aiding in debugging and tuning the pipeline.
ClickHouse’s performance under concurrent write and read operations must also be evaluated. Partitioning data by timestamp and service name is advised to avoid query contention. Benchmark tests conducted in June 2025 show that ClickHouse can handle over 1 million metrics per second with correct indexing and compression policies applied.
Improving Observability Under Load
After initial benchmarking, performance tuning should be iterative. Increasing the Collector’s memory buffer size and optimising compression codecs like ZSTD or LZ4 improve throughput. Load balancers can distribute metric ingestion across multiple Collector instances to avoid single points of failure.
ClickHouse should be configured with appropriate disk I/O and CPU reservations. High-frequency queries benefit from replicated clusters with distributed query engines to reduce latency. Storage TTL policies prevent data bloat and ensure timely cleanup without manual intervention.
Finally, include chaos testing in your routine observability drills. Simulating Collector crashes, network latency spikes, or malformed metrics ensures the stack can recover gracefully and that incident responders have the visibility needed to act effectively under pressure.


